Feb. 2026 / Hacklytics 2026
CrisisLens
A Databricks-powered humanitarian intelligence platform that helps teams prioritize countries using natural-language analytics, simulations, and a 3D crisis command center.
TypeScript · React · Next.js · Tailwind CSS · Three.js · Databricks · Databricks SQL Warehouse · Databricks Genie · Python · PyTorch · Pandas · NumPy · Docker
Case study
Built with Jakob Laise, Alexander Paolini, Michael Rusu, Abduaziz Umarov
Why it stood out
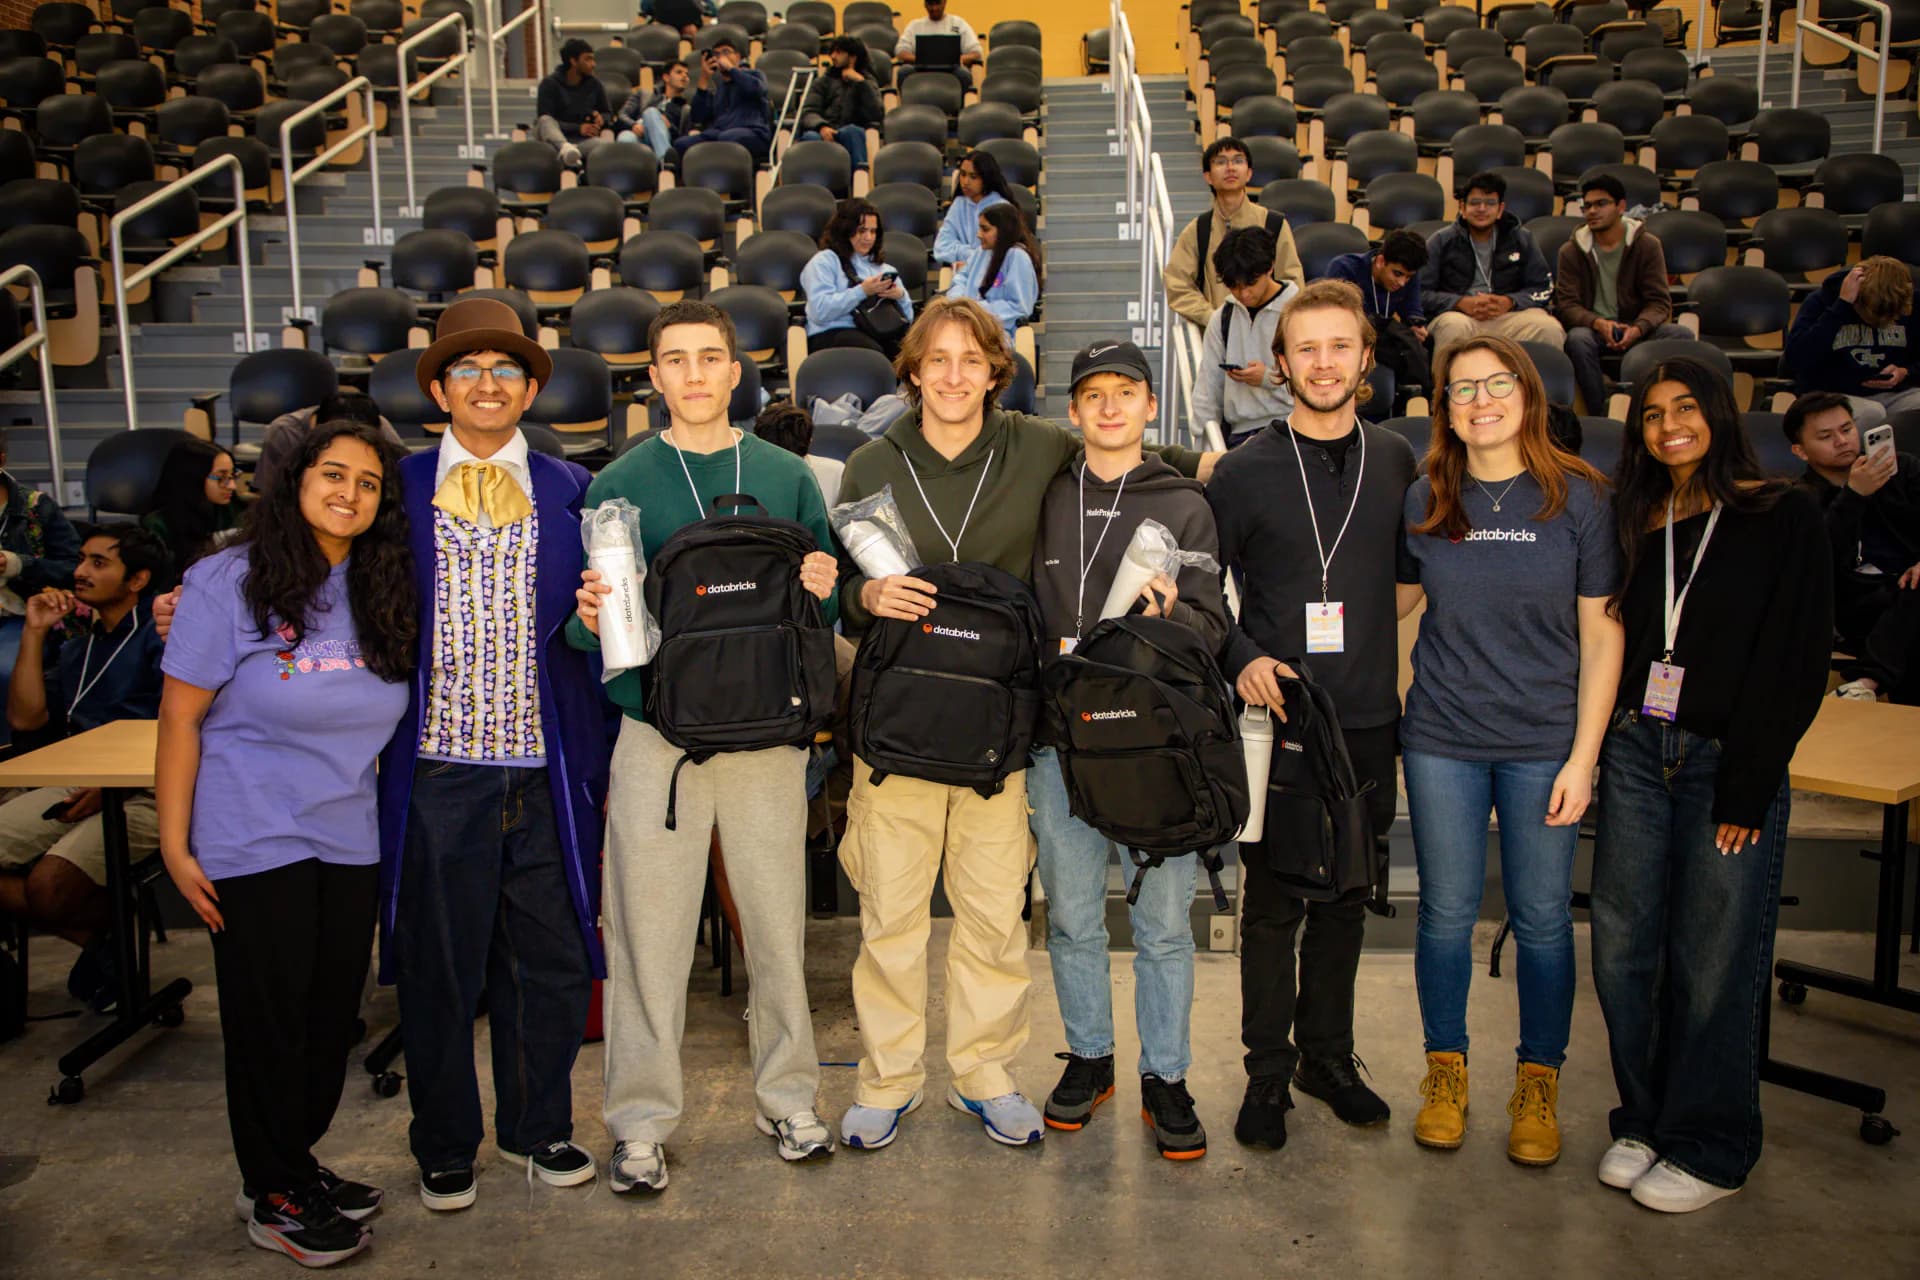
CrisisLens won 1st place out of 234 teams in the Databricks Geo-Insight Challenge at Georgia Tech's Hacklytics 2026 by tackling a problem that felt both technically rich and genuinely important: crisis prioritization. We built it as an AI-assisted humanitarian intelligence platform that helps analysts understand where risk, displacement, and funding gaps are converging, all from a single command center.
Product experience
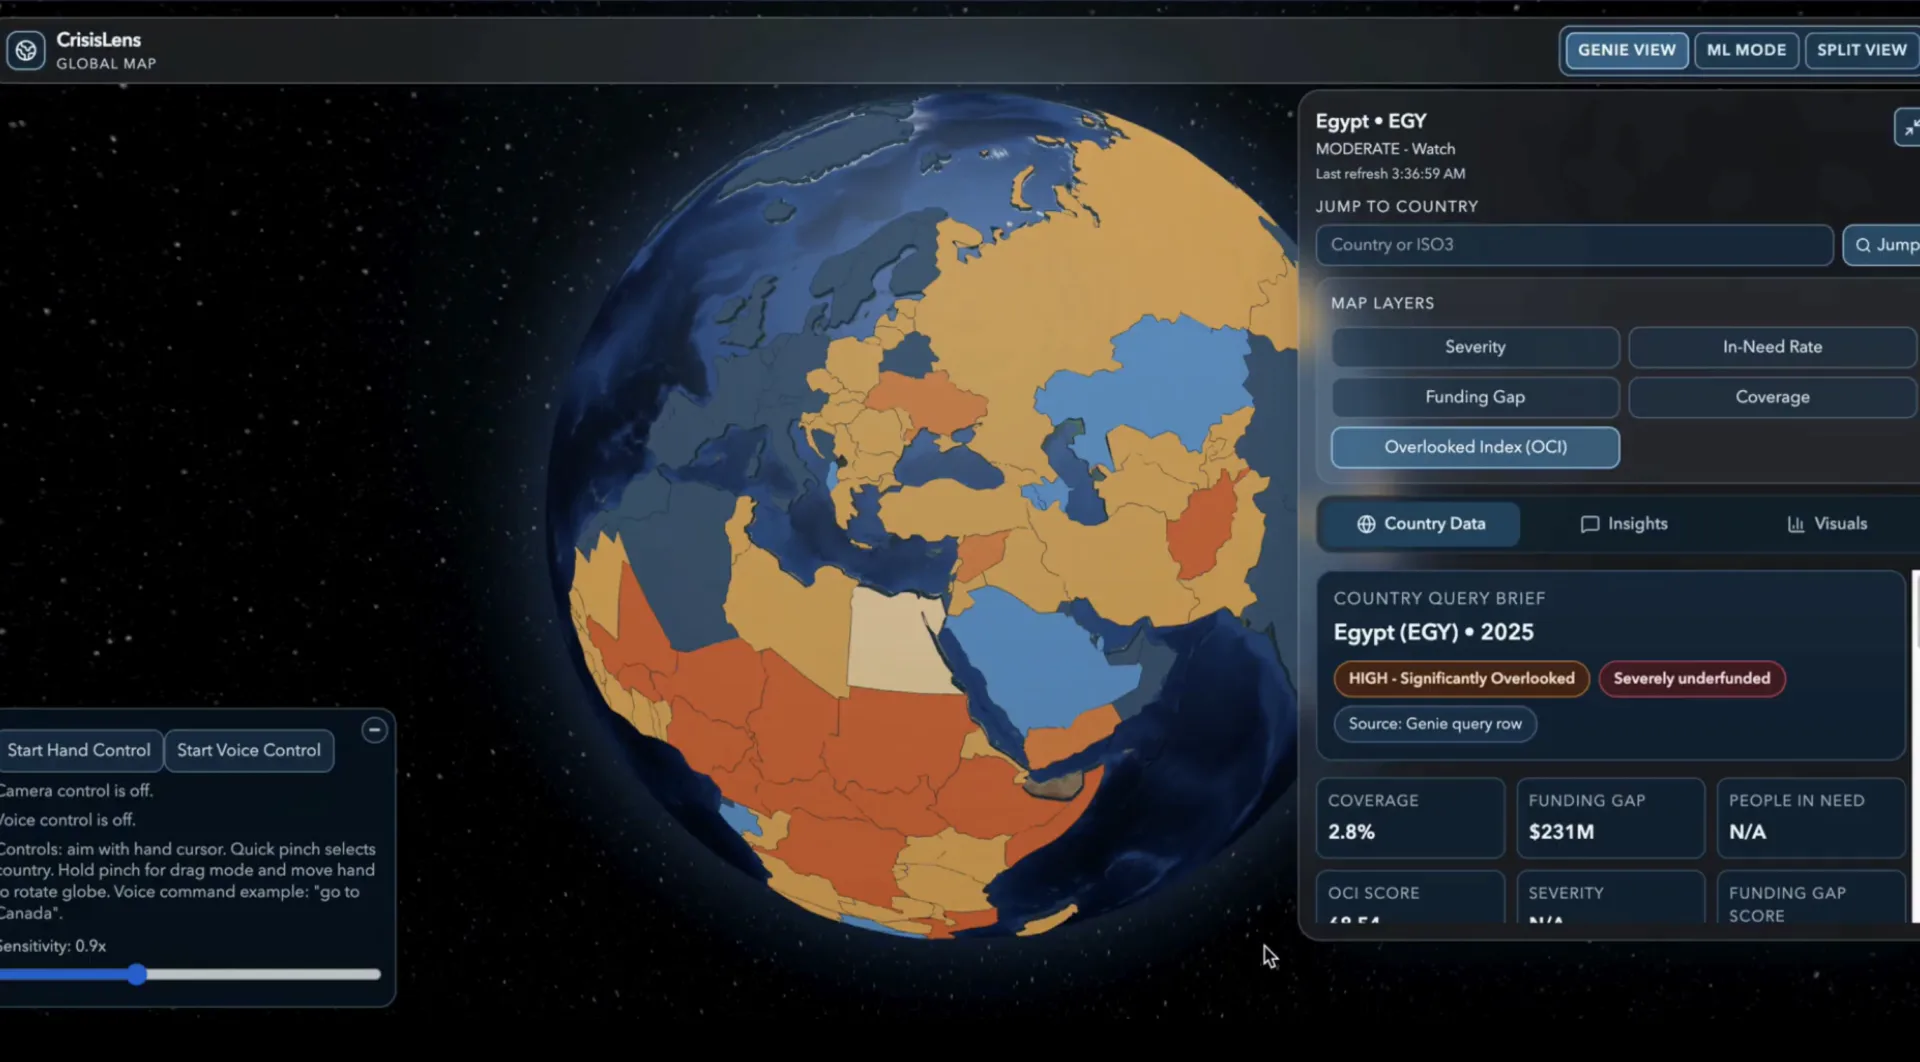
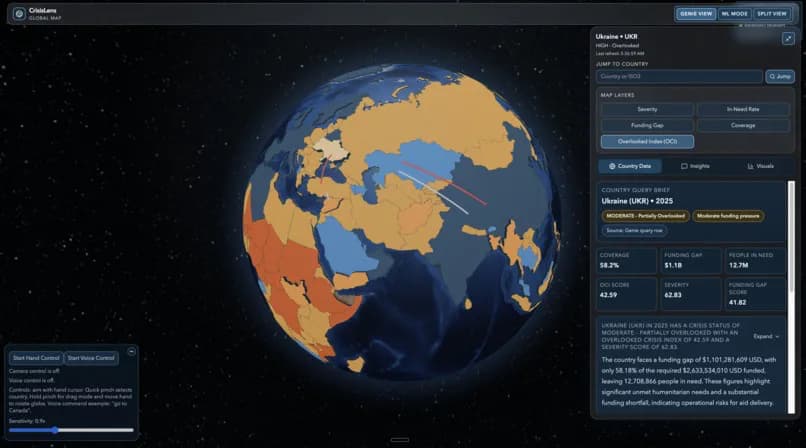
The core experience centered around an interactive 3D globe built with Next.js, React, TypeScript, Tailwind CSS, and Three.js. Instead of forcing users to bounce between spreadsheets, reports, and dashboards, CrisisLens gave them one operational surface for exploring country-level humanitarian conditions.
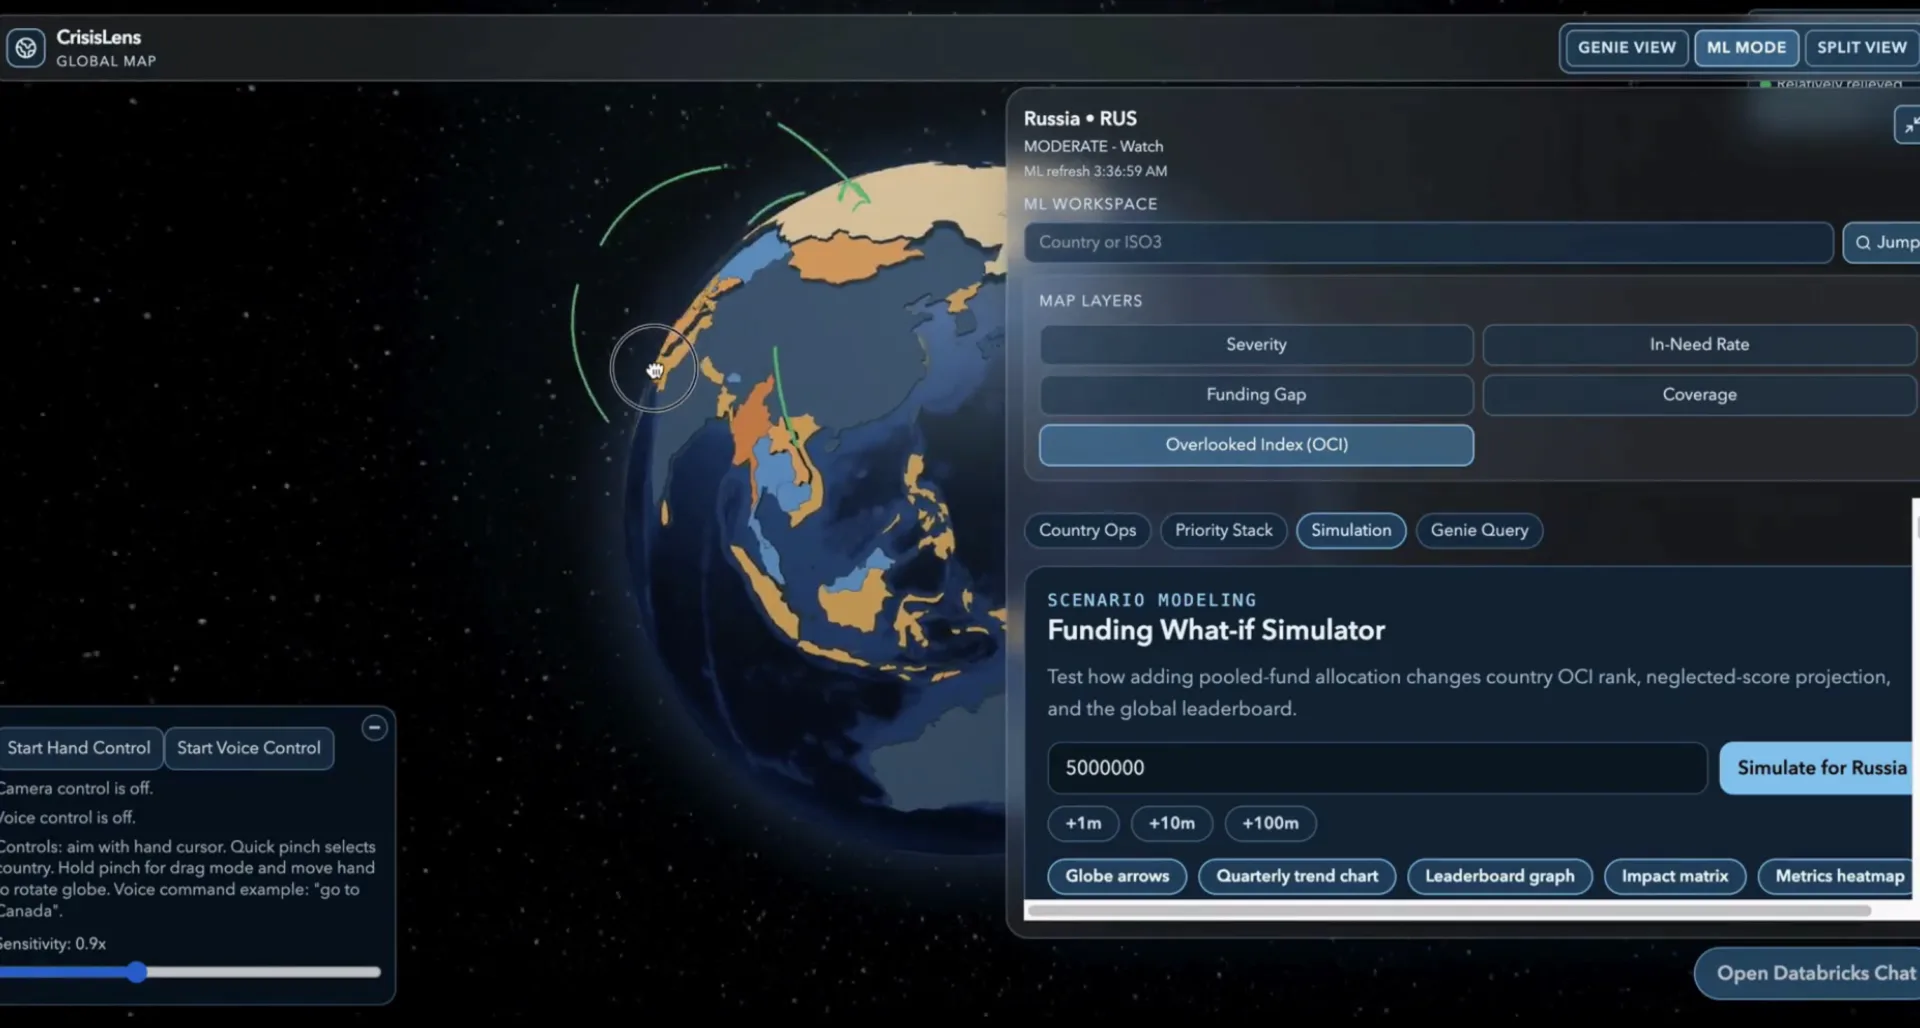
Analysts could inspect geography visually, compare regions, and move between multiple workflows, including natural-language analytics and simulation-driven exploration.
Analytics and modeling
On the analytics side, we integrated Databricks SQL Warehouse and Databricks Genie so users could ask real questions in natural language and get query-backed insights in return.
On the modeling side, we used PyTorch, Pandas, and NumPy to support cross-country impact simulations and more forward-looking humanitarian analysis. What made the project exciting was that it felt less like a flashy demo and more like a serious decision-support tool.
Highlights
- 1st place out of 234 teams in the Databricks Geo-Insight Challenge at Hacklytics 2026
- Interactive 3D globe interface for country-level humanitarian risk and funding analysis
- Natural-language analytics pipeline powered by Databricks SQL Warehouse and Genie
- PyTorch-based simulation workflow for cross-country impact modeling